
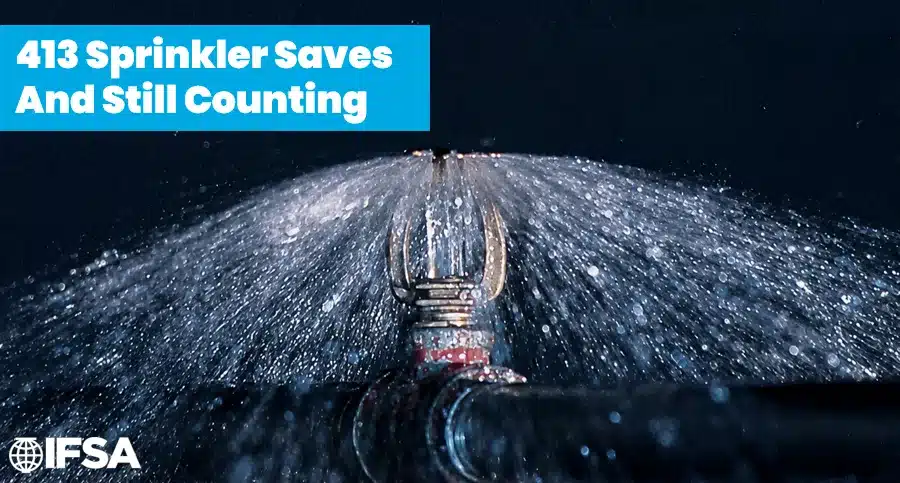
So far this year, IFSA has documented 413 sprinkler saves in twenty-one countries, on five continents, across forty-eight U.S. states and jurisdictions. That total is an under-representation. A save enters our record only if someone reports it: a fire department post, a local news story, a submission from a member. Most saves generate no news at all, so the real number is higher than 413, and that gap is the reason for this article.
Four hundred thirteen times this year, a fire started in a building where people lived, worked, learned, or healed. A device that had been sitting silently in the ceiling, sometimes for decades, opened and ended the emergency before it became a tragedy. The fires that make the news are the ones that go wrong. These are the ones that went right.
Sprinkler Saves Across 21 Countries
Of the 413 saves, 333 were reported in the United States and 80 across twenty other countries. Canada led the international count with 18, followed by the United Kingdom with 14 across England, Scotland, and Wales. Germany posted 7 and South Korea 6. China and Malaysia recorded 5 each, Australia and New Zealand 4 apiece, and Taiwan and India 3 each. The Netherlands contributed 2, and Japan, Singapore, Spain, Norway, Finland, Czechia, Turkey, Mexico, and Brazil each contributed one.
The variety inside that list is the point. In Kaohsiung, Taiwan, two cats left home alone switched on an induction cooktop, and the apartment sprinklers handled what followed. On the Dwarka Expressway outside New Delhi, an automatic system controlled a vehicle fire inside a primary motorway tunnel. In Jeonju, South Korea, an arson fire at a hotel was stopped before the fire service arrived. Local coverage contrasted that outcome with an earlier, unsprinklered hotel fire that had killed seven people. Same country, same building type, same category of fire, opposite outcome. The variable was the sprinkler system.
Different building codes. Different water supplies. Different inspection regimes, languages, and regulatory histories. Same physics, same result. And that consistency is the evidence base: a case made in one country transfers to the next.
Residential Occupancies Account for Roughly 42 Percent of the Total
Residential occupancies account for roughly 42 percent of the total: apartments, condominiums, senior living communities, student housing, and hotels. This is exactly where people are asleep and least mobile; where fires most often turn fatal. In Olathe, Kansas, a single sprinkler knocked down a nursing home fire before it could spread, and residents were relocated inside the building. A residence hall fire in Iowa City, contained. A fire at a fire station in Potomac Heights, Maryland, because the fire service is not exempt either. The remaining 58 percent spans nearly every category in the model codes:
- Business (57 saves, 14%): offices, retail service, auto shops
- Assembly (44, 11%): restaurants, fitness centers, houses of worship
- Factory and industrial (40, 10%): manufacturing and processing plants
- Educational (30, 7%): elementary schools, high schools, colleges
- Institutional (23, 6%): hospitals, clinics, nursing homes
- Storage (19, 5%): warehouses, distribution centers, ports
- Mercantile (18, 4%): supermarkets, department stores, retailers
- Utility and miscellaneous (9, 2%): recycling plants, tunnels, airports
No occupancy class is absent from the record. That is the argument for water-based suppression as a baseline expectation across the built environment rather than a specialty solution reserved for high-hazard risks.
Lithium-Ion Battery Fires: A Hazard the Statistics Haven’t Caught
Fifteen of the 413 saves involved lithium-ion batteries, e-bikes, e-scooters, or charging equipment, up from nine at the five-month mark. An e-bike battery exploded inside a home in Penn Township, Pennsylvania. A backup battery caught fire in the electrical room of a junior high in Puyallup, Washington. In Hereford, England, a battery pack fire at a food processing factory was contained. In Scio Township, Michigan, a battery explosion on a production line was held to a single workstation. In DeSoto, Kansas, a sprinkler system stepped in at an electric vehicle battery plant.
Battery fires are widely described as difficult to extinguish. And for the fire inside the cell that is accurate, since thermal runaway generates its own oxygen and can reignite hours later. Most of the damage in these incidents comes from what the battery ignites around it: bedding, furniture, packaging, adjacent stock. That is precisely what sprinklers control.
What the National Data Says About Sprinkler Performance
The entries in our tracker are individual incidents. Two national datasets, produced independently on opposite sides of the Atlantic, put them in context.
NFPA’s U.S. Experience with Sprinklers (April 2024) found that where sprinklers were present, the civilian fire death rate was 90 percent lower and the civilian injury rate 32 percent lower than in properties with no automatic extinguishing system. Firefighter injury rates were 35 percent lower. Fire was confined to the object or room of origin in 94 percent of sprinklered fires, against 70 percent where no system was present. On dependability, sprinklers operated in 92 percent of fires large enough to activate them and were effective in 97 percent of those cases. The most common reason for failure was a system shut off before the fire started.
The UK analysis reached much the same conclusion by a different route, reporting operational dependability of 94 percent and performance effectiveness of 99 percent. The detail behind that figure is the useful part. Of 879 fires where a system was present but did not operate, most involved fires outside the covered area or too small to trigger the system, and only 57 were cases where a system could have been expected to work and did not. “Did not operate” almost always means “was not supposed to.”
Both studies also speak to individual sprinkler activation. NFPA found that one sprinkler operated in 77 percent of fires where any operated at all, and five or fewer in 96 percent. The UK analysis found an average of 2.7 operating sprinklers across all building types, and 1.5 in dwellings.
The UK data also quantifies damage. Dwelling fires where sprinklers operated averaged under 4 square meters (43 square feet) of fire damage, against 18 to 21 square meters (194 to 226 square feet) across all dwelling fires in England, a reduction of roughly 75 percent. For non-residential buildings the reduction was about half. Both studies underline how much work remains. Sprinklers were present in only about 7 percent of reported US home structure fires between 2017 and 2021. Residential leads our save count despite being the least protected occupancy class of all.
Help Us Count What We’re Missing
413 reported sprinkler saves is a starting point. A floor, not a ceiling. Every entry in this tracker comes from a public report or a direct submission. A save only enters the record if a fire department posted about it, a local outlet covered it, or someone took two minutes to send it to us. Most generate no news at all, which is the nature of a fire stopped at three hundred dollars of water damage. Notice the gaps in our own data: Montana, South Dakota, and Wyoming show zero saves this year, which almost certainly reflects reporting patterns rather than fire outcomes. So does the fact that 81 percent of our saves come from a single country. The true number is higher than 413. Closing that gap is a job the fire protection community can only do together.
If you know of a sprinkler save, please report it at ifsaglobal.org/sprinkler-saves-2. Incidents from anywhere in the world, of any size, in any occupancy — a trash can fire in a stairwell counts as much as a factory blaze. Send the date, city, country, a one-line description, the occupancy type, and a link to any coverage or your department’s own report.
Fire officials, contractors, inspectors, insurers, and building owners see these outcomes before anyone else does. A post from your department, a note in an inspection file, a line in a local paper — any of it can become a documented data point supporting sprinkler requirements in the next code cycle, the next legislative hearing, the next skeptical client meeting.
Every save you send us is one more fire that didn’t become a tragedy, on the record, where it can do some good.
References
- National Fire Protection Association. U.S. Experience with Sprinklers. NFPA Research, April 2024. Analysis of 2017–2021 national incident data.
- Optimal Economics. Efficiency and Effectiveness of Sprinkler Systems in the United Kingdom: An Analysis from Fire Service Data. Prepared for the National Fire Chiefs Council and the National Fire Sprinkler Network, May 2017. Distributed by the British Automatic Fire Sprinkler Association. Analysis of 2,294 incidents reported by 47 UK fire and rescue services, 2011–2016.
- International Fire Sprinkler Association. Sprinkler Saves 2026 incident tracker. Documented saves reported publicly and submitted to IFSA between January 1 and July 31, 2026.
- Fire Statistics Data Tables 0204 and 0304, cited in the Optimal Economics analysis as the comparison baseline for average fire damage areas in England, 2011/12–2015/16. Published by the Home Office at the time of the analysis; responsibility transferred to the Ministry of Housing, Communities and Local Government in April 2025.